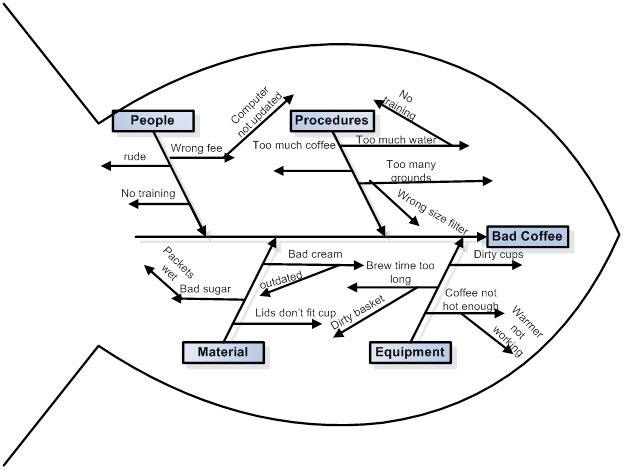
In the world of quality control and process improvement, understanding the intricate pathways of processes is vital. One tool that aids in visualizing these pathways is the tree diagram. Think of it as a map that guides us through the labyrinth of operations, helping us identify areas for optimization and efficiency. In this article, we’ll delve into the concept of tree diagrams, exploring how they can be used to streamline processes and enhance quality.
What are Tree Diagrams?
Tree diagrams are visual representations that display the hierarchical structure of a process or system. Imagine a tree with branches spreading outwards, each branch representing a different aspect or stage of the process. These diagrams help break down complex processes into simpler, more manageable components, making it easier to analyze and understand.
The Anatomy of a Tree Diagram
At the core of a tree diagram lies the main process or objective. From there, branches extend outward, representing different decisions, outcomes, or subprocesses. Each branch further divides into smaller branches until the entire process is mapped out comprehensively.
Application in Quality Control
In quality control, tree diagrams serve as valuable tools for identifying potential sources of defects or inefficiencies within a process. By visually mapping out each step and decision point, quality control teams can pinpoint areas where improvements are needed.
Identifying Root Causes

One of the primary uses of tree diagrams in quality control is to trace defects back to their root causes. By examining the branches of the diagram, analysts can determine which factors contribute to defects and prioritize corrective actions accordingly.
Analyzing Process Flow
Tree diagrams also help in analyzing process flow. By visually representing the sequence of steps and decision points, teams can identify bottlenecks or areas where processes can be streamlined for greater efficiency.
Process Improvement with Tree Diagrams
In the realm of process improvement, tree diagrams play a pivotal role in guiding decision-making and facilitating continuous enhancement.
Decision Analysis
Tree diagrams enable organizations to conduct thorough decision analysis. By evaluating different scenarios and their potential outcomes, decision-makers can make informed choices that drive process improvement initiatives.
Optimizing Resource Allocation
Efficient resource allocation is essential for process improvement. Tree diagrams help organizations allocate resources effectively by identifying areas where investments can yield the greatest returns in terms of quality and efficiency.
Practical Example: Streamlining a Manufacturing Process
Let’s consider a practical example of how tree diagrams can be applied to improve a manufacturing process. Imagine a company that produces electronic devices. By using a tree diagram, the company can map out the entire manufacturing process, from sourcing components to final assembly.
Identifying Critical Points
Through the tree diagram, the company identifies critical points where defects commonly occur, such as during component assembly or quality testing.
Implementing Solutions
With this insight, the company implements targeted solutions, such as implementing stricter quality control measures during assembly or enhancing testing protocols to detect defects earlier in the process.
Conclusion: Navigating the Path to Excellence
In the dynamic landscape of quality control and process improvement, tree diagrams serve as indispensable tools for navigating the complexities of operations. By providing clarity and structure, these diagrams empower organizations to identify areas for enhancement, optimize processes, and ultimately achieve excellence in quality and efficiency.